
Modules
Dynamic Insights
Interactive dashboards for fast, intuitive analysis.
Dynamic Insights is the visual heart of Data Navigator — a suite of intuitive, dynamic dashboards that translate large, complex healthcare data sets into clear, actionable answers. Designed for both non-technical users and seasoned analysts, these dashboards are refreshed with every data cycle so users always have access to the most current information available.
Dynamic Insights organizes information into a series of policy-focused domains that help users easily explore trends, identify opportunities, and monitor changes over time. Each domain can be configured to match specific analytic priorities, and new domains can be added whenever needs evolve.
Dynamic Insights’ standard reporting domains include:
Executive Insights
Readily access key performance indicators and summaries of member characteristics, spending patterns, service use, and more for easy use in leadership briefings, board presentations, and legislative reporting.
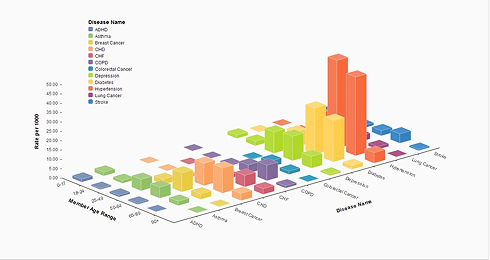
Cost Insights
Explore leading cost drivers and variation in spending patterns by condition, payer, geography, service category, and population characteristics to more easily identify areas where cost-saving opportunities may exist.
Member Insights
Track preventive care utilization, chronic condition management, care gaps, and other key indicators to better understand population health trends and disparities.
Provider Insights
Evaluate provider and facility performance across measures of cost, quality, and utilization to help identify high-value providers and areas where targeted interventions may improve outcomes.
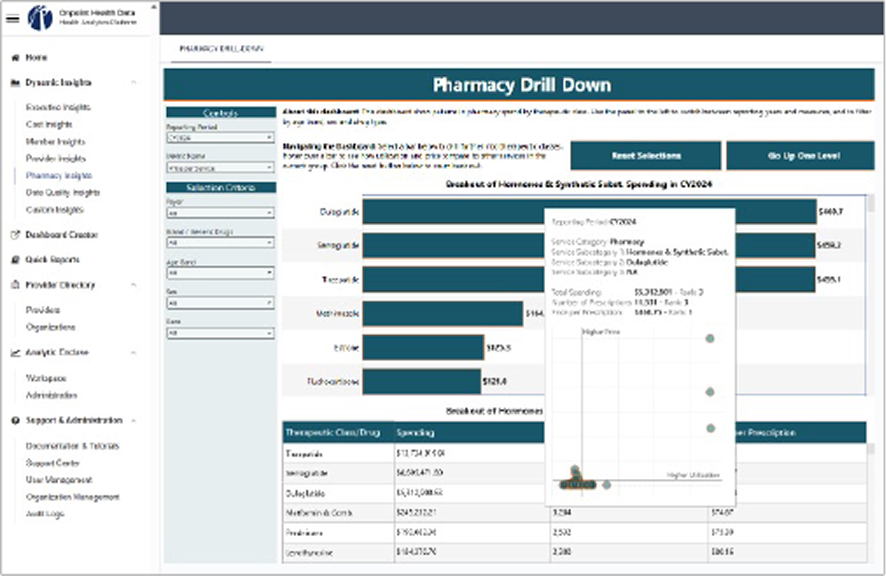
Pharmacy Insights
Drill into pharmacy utilization and spending, including specialty drug trends, adherence patterns, and opportunities for generic substitution.
Data Quality Insights
Monitor submission completeness, timeliness, and field-level accuracy across your data suppliers for unprecedented transparency into data quality and completeness.
Custom Insights
Build customized views of key metrics using simultaneous stratifications such as geography, payer, condition, age, and risk to explore patterns, compare populations, and answer complex policy questions.
Discover Dashboard Creator
Ready to study something different? Dynamic Insights also offers a Dashboard Creator that lets users take their own track to explore the data. Dashboard Creator helps authorized users design custom dashboards directly within the platform using leading data visualizations like Tableau and Power BI for tailored views into specific programs, populations, and policy areas.